|
2 › Kinematics Motion in 1-Dimension
∙F › Mixed Questions on Case 1, 2 & 3
Case 1 - Steady Speed (or Constant Velocity)We can use the familiar equation: \(speed=\frac{distance}{time}\)Watch Out! The oldest trick is to mix up the units on these questions...e.g. A train travels at 12 m/s for 1 hour 15 mins. Find the distance travelled in kmThe speed in in m/s, so the distance should be in m and the time in s: ┐ t = 75×60 = 4500 s ├ So: distance = speed × time s = 12 ┘ = 12 × 4500 = 54,000 m = 54 km Displacement: So far, we have only used the idea of 'distance' in these questions. We can easily extend the idea by imagining the place that we start from is NOT the same as the place that we are measuring the displacement from...
e.g. My house is 25km from yours. I start walking from your house towards my house at a rate of 4 km/h. Let x = displacement from from my house at time t hours. Find an equation for xFor constant speed situations, the equation is always of the form:\(x\,\,=\,\,\color{#b0dea9}{x_0}\,\,+\,\,\color{#9ad6d5}{v}t\)\(x_0\) = initial displacement
|
So start at ┌─ 40 m/s │(on y-axis) │ |
His deceleration is 4 m/s² (ie acceleration of -4 m/s²) So the gradient = -4 |
Then: steady speed for 10 seconds └────────────┬──────────────┘ |
Finally, brakes, so that his
       speed = 0 when t=25
      └──────────────────┬┘
|
|
│ │ └─► |
     └─┬─┘
       │
       │
       │
       │
|
             │
             │
             │
             │
         ┌───┴───┐
|
                         │
                         │
                         │
                         │
                         │
                         │
                         │
                         ▼
|
|
┌──────┴─────────────────────┐ │Since we know this continues│ │until speed drops to 20 m/s:│ ├────────────────────────────┤ │ grad = up │ │ across │ │ │ │ -4 = -20 │ │ across │ │ │ │ => across = 5 │ └────────────────────────────┘ |
Note: This relationship:
                                        gradient  =  acceleration

                                AND     gradient  =    up
                                                     across
is used a lot to get x- and y-values labelled on our grid!
Case 3 - Situations Involving ONLY Uniform Acceleration
When the object undergoes constant acceleration / deceleration over the entire time period we are investigating we can apply the equations for constant acceleration:
The 5 Equations of Constant Acceleration |
┌───┐ │ 1 ├───► v = u + at └─┬─┘ ┌─┴─┐ │ 2 ├───► v² = u² + 2as └─┬─┘ ┌─┴─┐ │ 3 ├───► s = ½ t (u + v) └─┬─┘ ┌─┴─┐ │ 4 ├───► s = ut + ½at² └─┬─┘ ┌─┴─┐ │ 5 ├───► s = vt - ½at² └───┘ |
Where: u = initial velocity (at start of acceleration) v = final velocity (at end of acceleration /deceleration) a = acceleration / deceleration t = time of journey s = displacement (NOT distance travelled) between start point & end point |
e.g. A ball is thrown upwards at 25 m/s. At the point when it is released, the throwers arm is 2m above the ground. On the balls downward path, it passes through a basketball hoop which is 22m above the ground. At what speed does it pass through the hoop?
Our initial diagram looks		Then we add in a set of axes centered on
like the one on the left...		the point where the ball is starting from
We also add arrows showing the direction in which the ball is thrown

The ‘direction’ in which gravity acts… And the ‘direction’ of the displacement…

THEN DEFINE WHICH DIRECTION IS +VE
                                   ▲
In this case, I'm gonna define     ║ upwards as +VE
            ╖
So: u = +25 ║
    v = ??? ╟────► Equation (2) omits ‘t’:
    a = -10 ║                               v² = u² + 2as
    s = +20 ║                               v² = (25)² + 2(-10)(20)
    t = xxx ║                            => v  =  15 m/s
            ╜
Question 1: This is CASE 1: Steady Speed
(although his speed might have fluctuated a bit over the 6 minutes, we are interested in his average speed - so it's still CASE 1...)
The only trick with this question is the MIX-UP of units, km, minutes and m.p.h. (miles-per-hour) - but to be honest CASE 1 is SO SIMPLE, there's really no other to make this even slightly challenging...
So we know that, even though the speed limit is \(70\) m.p.h. - they won't actually charge you unless they think you were going at \(77\) m.p.h. (i.e. 10% above 70 m.p.h.) OR MORE...
So let's find out what speed Lewis was doing:
LET THE UNITS OF THE SPEED DICTATE THE UNITS of everything else...
Convert the \(12\) km into miles (Use the scale factor: \(1.6\,km\,\,\longrightarrow \,\,1\,mile\))
Convert the \(6\) minutes into hours (Use the scale factor: \(60\,minutes\,\,\longrightarrow \,\,1\,hour\))
Question 2: Firstly, we gotta decide whether this is Case 1, Case 2 or Case 3:
This is: CASE 1: Steady Speed
So, what is happening in this question is that we gotta treat each \(6\) km interval of the \(42\) km marathon as a separate section...
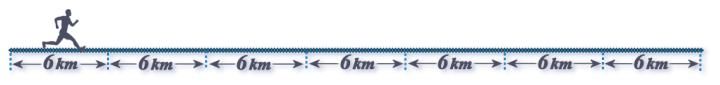
So, there are SEVEN of them...
So starting with the 1st INTERVAL:
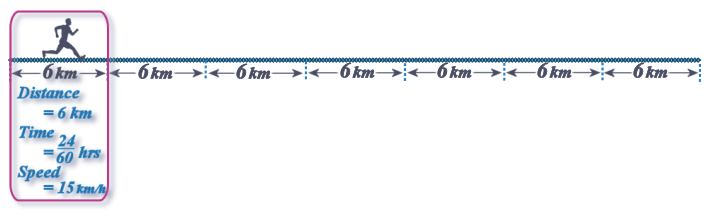
Moving on to the 2nd INTERVAL:
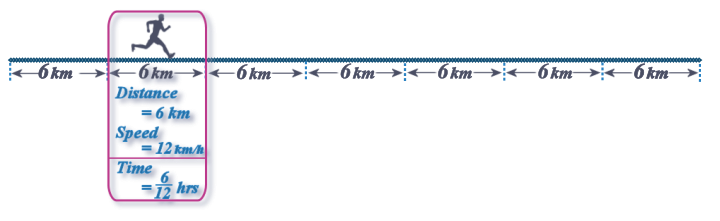
So the time - IN MINUTES - for the 2nd section is: \(30\) minutes...
Carry on and work out the time for the 3rd INTERVAL...
Then examine the list of the times for the 1st interval, the 2nd interval and the 3rd interval (they say there's a pattern there - try to identify it...)
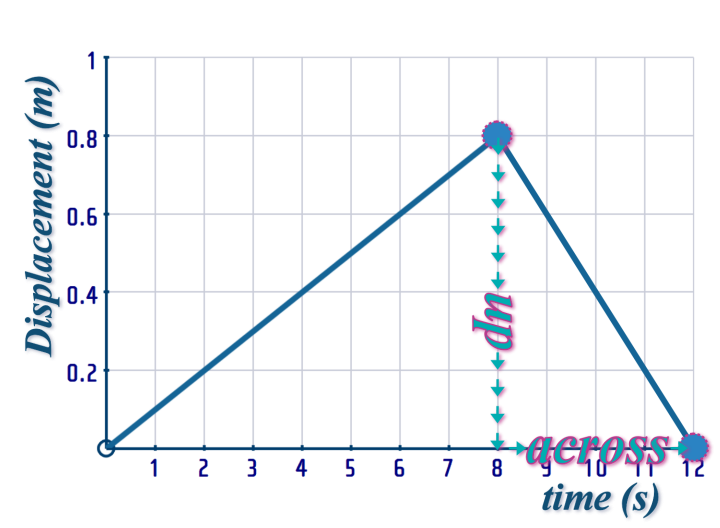
Question 3: So, what we've gotsta do is to transfer as much information from the displacement-time graph, onto a new velocity-time graph...
The first thing we know is that the gradient of the displacement-time graph gives the velocity...
On a displacement-time graph, the ‘gradient’ gives the velocity
In this case, we have a straight-slope, so the gradient is the same all along the line...
...which means STEADY-SPEED!
To find the speed, we pick two points at the ends of the straight line and then use: \(gradient\,\,=\,\,\frac{up}{across}\):
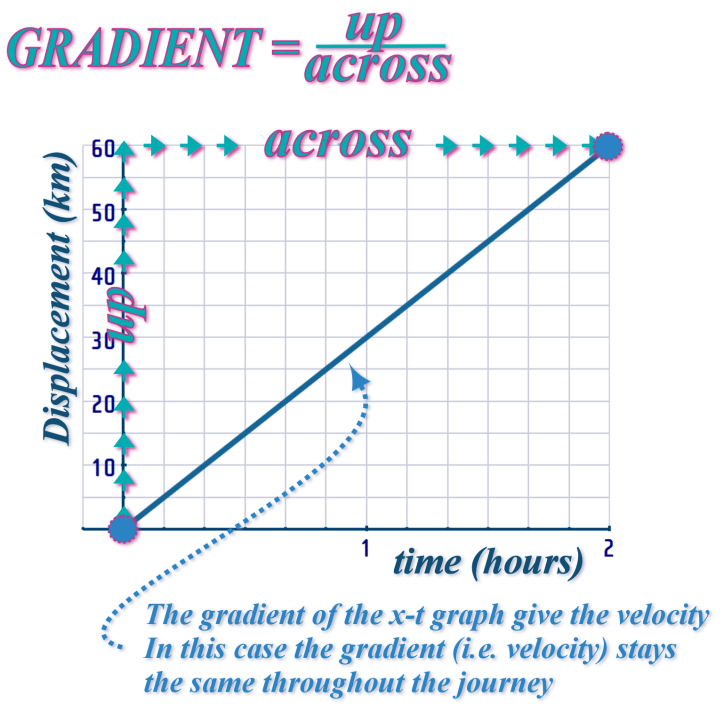
So, here's what we about this journey:
- It was a \(2\)-hour journey
- The motion was steady-speed (of .... km/h) throughout the \(2\)-hour journey
- The distance travelled during the journey was \(60\) km
So now, we can draw a velocity-time graph for this journey:
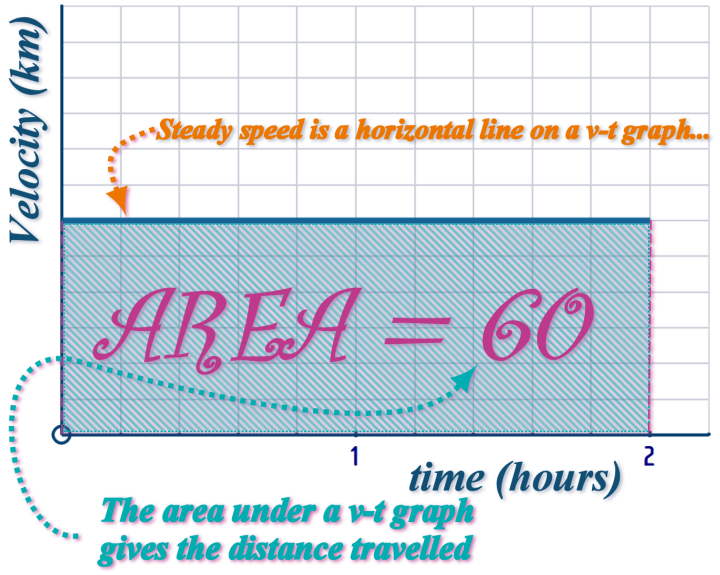
On our v-t graph, we can show everyone that we KNOW the distance travelled during this journey:
The distance travelled tells us the ‘area’ under the velocity-time graph
There - we've place ALL OF THE INFORMATION that was given on the x-t graph, onto a new v-t graph...
Question 3, part (b): Similarly to Question 2, we can start by finding the gradients (which tell us the velocities) for each interval:
Looking at the 1st interval:
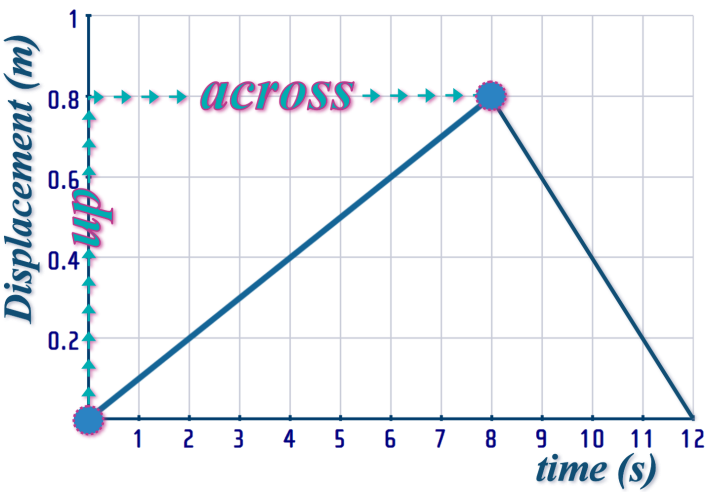
So, the VELOCITY between \(t=0\) and \(t=8\) is: \(⋯\) m/s
For the 2nd interval:
So, here's what we about this journey:
- It was a \(12\)-second journey
- For the first \(8\) seconds, it was UNIFORM VELOCITY of \(...\) m/s
- The distance travelled during these \(8\) seconds was \(0.8\) m
- For the next \(4\) seconds (\(t=8\) to \(t=12\)), it was uniform velocity of \(-0.2\) m/s (the -VE indicates the direction has been reversed...)
- The displacement over these \(4\) seconds is \(-0.8\) m (the -ve indicates the direction is reversed)
- Over the entire \(12\) seconds; the displacement is \(0\) m (i.e. the object has returned to its starting point...)
So now, we can draw a velocity-time graph for this journey:
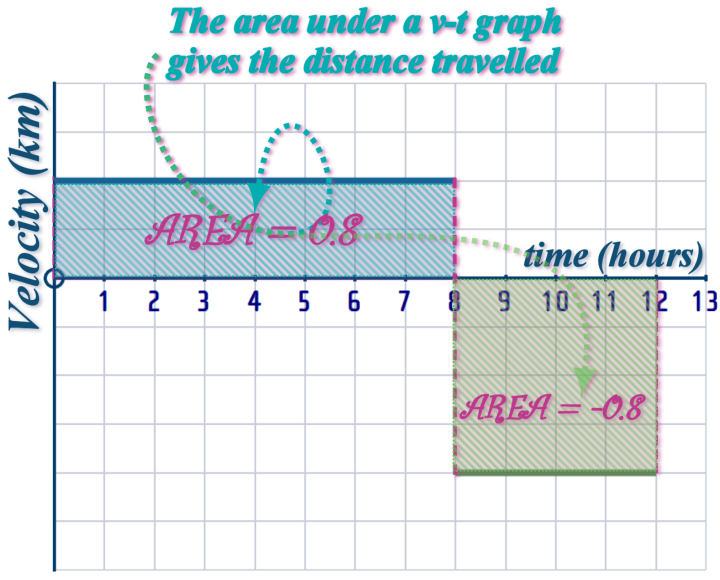
There - we've placed ALL OF THE INFORMATION that was given on the x-t graph, onto a new v-t graph...
Question 3, part (c): This time we have THREE separate intervals to consider:
Interval 1: The object is moving at steady speed of \(...\) m/s for \(20\) seconds, covering a distance of \(250\) m
Interval 2: The object is stationary for \(80\) seconds
Interval 3: The object is travelling in the opposite direction with a speed of \(...\) m/s for \(20\) seconds. During that time, the displacement is \(-250\) m
At the end of the THREE intervals, the object has returned to its starting point (i.e. the displacement is \(0\) m)
NOTE: The distance travelled is \(500\) m
Question 4: You can print off a big copy of the displacement-time graph for this question here...
This displacement-time graph has \(5\) intervals:
Interval 1: \(t=0\) to \(t=2\)
This section of the displacement-time graph is curved; with an INCREASING GRADIENT over the interval \(t=0\) to \(t=2\)
At \(t=0\), we can say that the curve has a gradient of ZERO
At \(t=2\), we can say the curve has the SAME GRADIENT is the dark-blue line portion that it connects to (at \(t=3½\))
Interval 2: \(t=2\) to \(t=3½\)
This is steady speed: We can pick the endpoints of this line and find the gradient to give us the velocity.
Interval 3: \(t=3½\) to \(t=7\)
This light-blue line portion is HORIZONTAL. On a displacement-time graph, that means STOPPED
Interval 4: (t=7\) to \(t=9\)
This is steady speed (but in the opposite direction): We can pick the endpoints of this line and find the gradient to give us the velocity.
Interval 5: \(t=9\) to \(t=10\)
This section of the displacement-time graph is curved; with an DECREASING GRADIENT over the interval \(t=9\) to \(t=10\)
At \(t=9\), we can say the curve has the SANE GRADIENT is the dark-green line portion before it
At \(t=10\), we should probably draw a TANGENT to fine the gradient (velocity) at this point
Question 5: This is motion in 1-Dimension (along the x-axis):
Actually, we don't need to decide whether this is Case1, Case 2 or Case 3 - because they just want us to use their equation - nothing else (but incidentally, it is CASE 3)
What we can see it, initially, it moves to the right - but soon after (i.e. from \(t=1\)) is it moving to the left...
Part (a): At \(t=0\), \(x=12\) - so the initial displacement is \(12\). To find the initial velocity, we need to find the gradient at \(t=0\)
Part (b): The displacement at \(t=10\) is simply given by putting \(t=10\) into the equation... It tells us how far from the "ORIGIN" the particle is at \(t=10\)
To find the distance travelled between \(t=0\) and \(t=10\), we have to watch the motion of the particle (in the applet) and see how far the particle travels: That means finding out how far it travels to the right (i.e. between \(t=0\) and \(t=1\)) and then how far it travels to the left (between \(t=1\) and \(t=10\)) and adding those two together
Question 6: Firstly, decide if this is Case 1, Case 2 or Case 3
It's CASE 3: Uniform acceleration for the entire interval under investigation
The tricky part of this question is deciding what the displacement is:
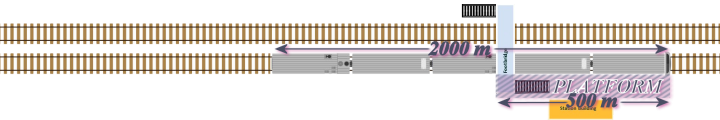
Think about when the nose of the train reaches the left-most side (i.e. the start) of the platform...
...then think about when the tail of the train passes the right-most (i.e. end) of the platform!
Defining RIGHT as +VE:   ═══════►
                           +VE
              	╖
So:   u = +⅚  	║
      v = xxx ──╫──────► Equation (4) omits ‘v’:
      a = +⅙  	║                            s 	=   u t + ½ a t²
      s = +⋯  	║                            ⭭      ⭭       ⭭
      t = ??? 	║                            ⋯	=  (⅚)t + ½(⅙)t²
              	╜
                                           => t = ⋯ or t = ⋯
Question 7: We've got an initial period of acceleration (that's the bit where he slowly rises from the crowed down position occupied ‘in the blocks’ to the fully upright running position)...
...then a period of steady speed...
...finally (because its USAIN and he's probably about \(20\) m ahead of the 2nd place runner at this point), he eases off a bit and by the time he crosses the line, his speed as dropped off slightly from his peak!
This is: CASE 2: Variable Motion; with periods of acceleration, steady speed and deceleration during the interval under investigation
That means - we MUST draw a v-t graph - a sketch graph will do, it doesn't have to be on graph paper...
Let's take this ONE INTERVAL AT A TIME:
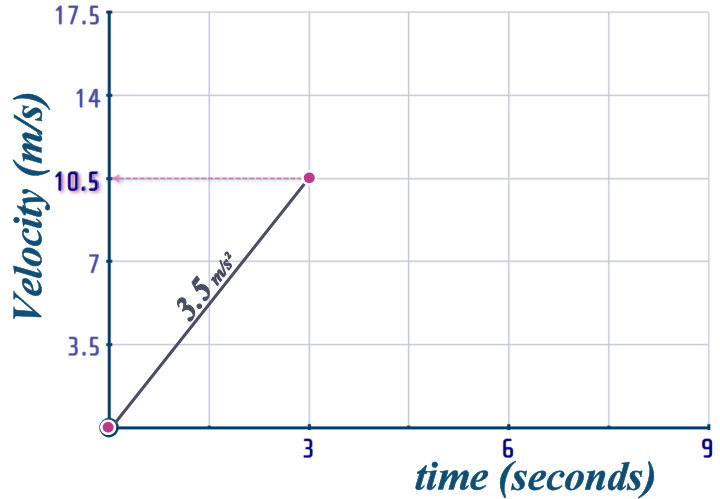
1st INTERVAL: First acceleration phase
We know that he starts from REST and that his acceleration is \(3.5\) m/s²...
...on a v-t graph, this is represented with a straight line, \(gradient\,=\,3.5\):
The acceleration tells us the ‘gradient’ on the velocity-time graph
We know that this line continues to \(t=3\):
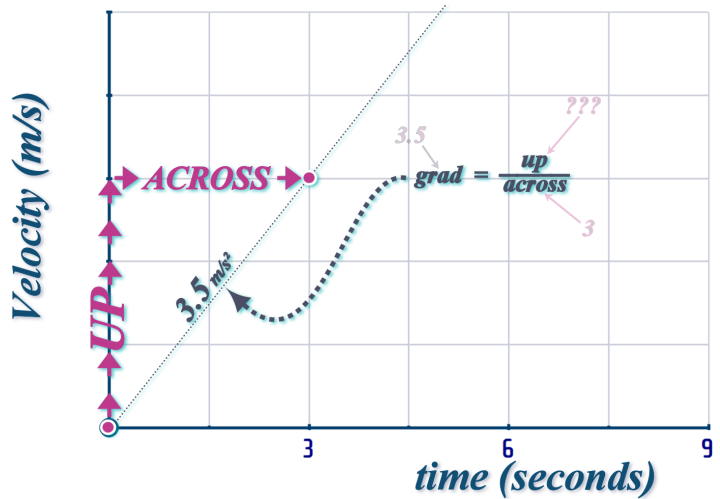
So we use: \(\begin{align} Gradient=\frac{up}{across}\,\,\Longrightarrow \,\,3.5&=\frac{up}{3}
\\
\Longrightarrow 3.5\times 3&=up \end{align}\)
So now we know where (on the y-axis) to terminate this line:
So, that's the first part of our v-t graph drawn...
2nd Interval: The second acceleration phase
So, we draw another straight line - but with gradient \(1.5\) (representing an acceleration of 1.5 m/s²), connecting to the end of our existing line (\(t=3,\,v=10.5\):
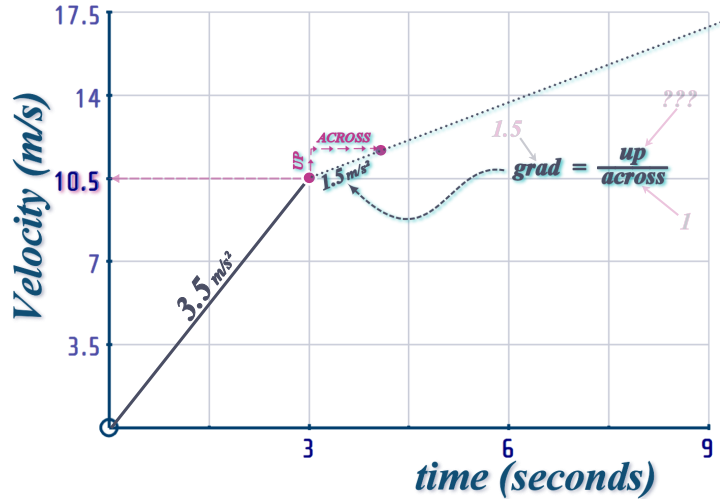
So we use: \(\begin{align} Gradient=\frac{up}{across}\,\,\Longrightarrow \,\,1.5&=\frac{up}{1}
\\
\Longrightarrow 1.5\times 1&=up \end{align}\)
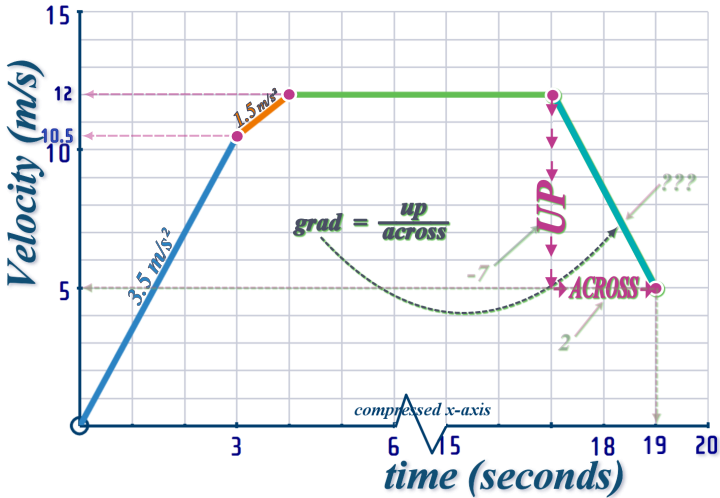
So now we know where (on the y-axis) to terminate this line...
The next bit is steady-speed which - on a v-t graph - is a horizontal line...
The final bit is deceleration from \(12\) m/s to \(5\) m/s over \(2\)-seconds (\(t=17\) to \(t=19\))
So, we end up with a v-t graph that looks like this
NOTE: I squished up the x-axis during the bit where he's running at steady speed to make it fit on the screen:
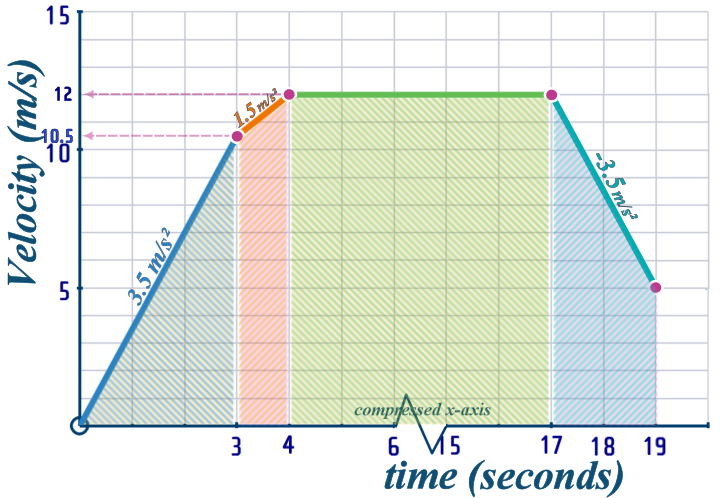
We need to find the DISTANCE-TRAVELLED, which is the AREA under a v-t graph...
On a velocity-time graph, the ‘area’ gives the distance travelled
To work out this area, we can divide it up into strips (a triangle, a rectangle and 2-trapezia):
Question 8: STINGERS are telescopic spiky strips that the police can stretched out across the road, so when the criminal drives over them, his tyres puncture, causing his car to decelerate radiply...
In this question, we are going to assume that, once the criminal crosses the 1st stinger, his car decelerates UNIFORMLY...
So, this is CASE 3: Uniform acceleration for the entire interval under investigation
BUT, it's complicated! Here's why:
If we consider the interval from when the car crossed the first stinger, until it came to a stop:
          ════════╩═════════════════════════╩═════════════════════════╩═════
                  │◄─────────11 m──────────►│◄──────────11 m─────────►│
                  ▲                         ▲                         ▲
  1st stinger ────┘                         │                         └──── 3rd stinger
                                      2nd stinger

Defining RIGHT as +VE:   ═══════►
                           +VE
            	╖
So:   u = ??? ──╫──────► WE HAVE
      v = ??? ──╫──────► THREE
      a = ??? ──╫──────► UNKNOWNS
      s = +22  	║
      t = 2     ║
              	╜
So, we don't have enough information to use the equations...
What we have here is TWO INTERLINKED INTERVAL
INTERVAL #1: From the 1st stinger to the 2nd stinger
INTERVAL #2: From the 1st stinger to the 3rd stinger:
Luckily the values of \(u\) and \(a\) care COMMON to both intervals (that's why I chose those tow and didn't chose the journey from the 2nd to the 3rd stinger!)
So now (using \(s=ut+\frac{1}{2}at^2\)), we can get two simultaneous equations and solve them to find \(u\) and \(a\)
After that, it's all gravy!
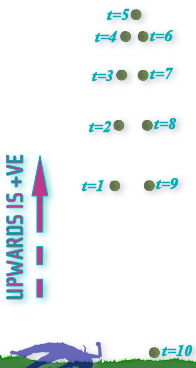
Question 9, part (a): This part is really easy, but it helps you to really understand what happens when you throw a ball up!
Firstly - WE MUST DEFINE WHICH WAY IS +VE (not defining the +VE direction is the biggest mistake to make on these questions)
As we are throwing the ball UPWARDS, it makes sense to define UPWARDS as +VE
|
In which case, the initial speed is is: \(+50\) m/s But the acceleration (due to gravity) is: \(-10\) m/s² (which means, every second, the speed reduces by 10 m/s) \(t\,=\,0\): \(v\,=\,50\) \(t\,=\,1\): \(v\,=\,40\) \(t\,=\,2\): \(v\,=\,30\) \(t\,=\,3\): \(v\,=\,20\) \(t\,=\,4\): \(v\,=\,10\) \(t\,=\,5\): \(v\,=\,0\) ‹–‹– This is the highest point \(t\,=\,6\): \(v\,=\,-10\) \(t\,=\,7\): \(v\,=\,-20\) \(t\,=\,8\): \(v\,=\,-30\) \(t\,=\,9\): \(v\,=\,-40\) \(t\,=\,10\): \(v\,=\,-50\) ‹–‹– This is when it returns to the starting point! |
 |
Question 9, part (b): Now, we gotsta draw a v-t graph of this - but it's sooo easy, you can just plot the points in the list above!!!
Question 10, part (a): Now, we are converting v-t (velocity-time) graphs into x-t (displacement-time) graphs...
...this one is quite tricky - normally, I make Part (a) the easiest - but I don't know what I was thinking here!
Never mind - I'll hold your hand through it; then Part (b) and Part (c) will be SUPER-EASY!
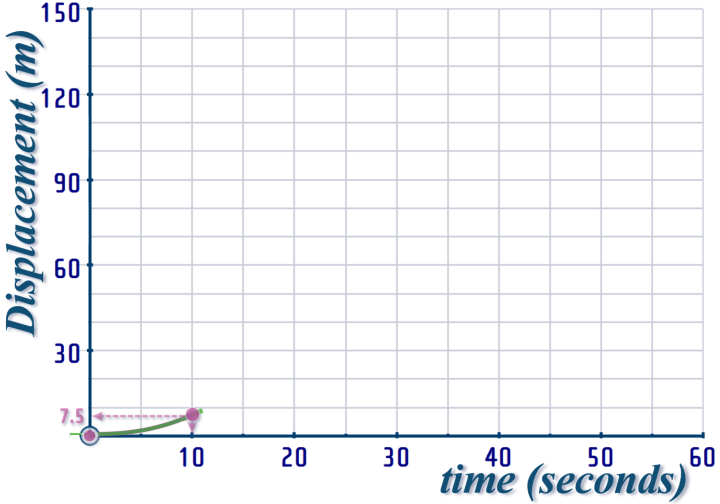
Looking at the first (\(10\) second) interval of the v-t graph - from \(t=0\) to \(t=10\):
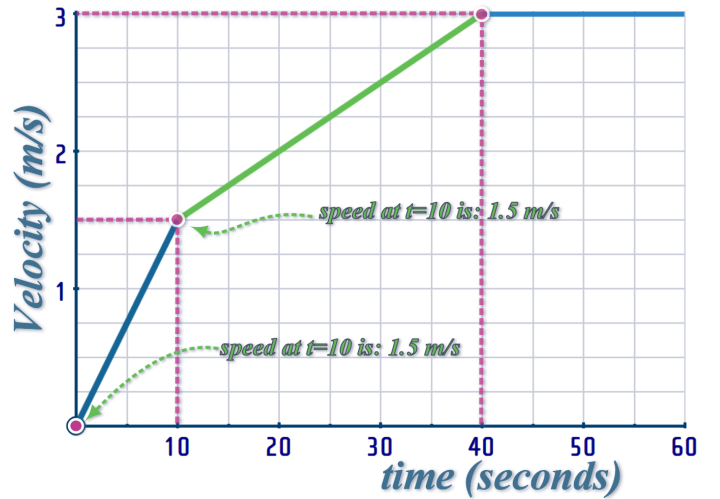
We can easily read directly off the y-axis, that the velocity increases from \(v=0\) to \(v=1.5\)
NOW: on an x-t graph, the velocity is is the gradient!
The velocity tells us the ‘gradient’ on the displacement-time graph
So, on our DISPLACEMENT-TIME graph; the GRADIENT at \(t=0\) will be ZERO...
...and the gradient at \(t=10\) will be \(1.5\)
During that same interval, we can work out the DISTANCE TRAVELLED by the particle:
On a velocity-time graph, the ‘area’ gives the distance travelled
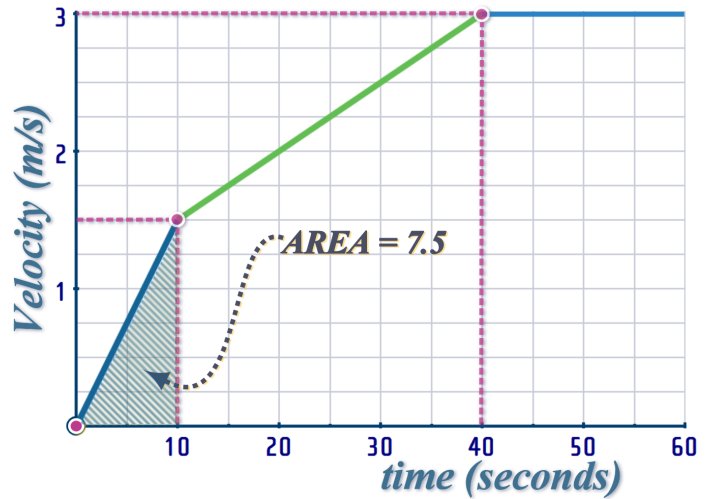
So, to draw our DISPLACEMENT-TIME graph; the first interval is from \(t=0,\,x=0\) to \(t=10,\,x=7.5\)...
And the GRADIENT increases from \(gradient=0\) to \(gradient=1.5\) during this interval:
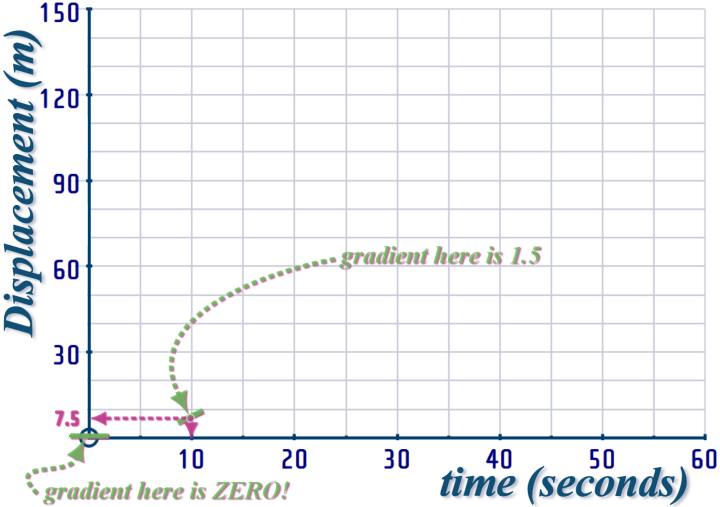
So, the first interval of the DISPLACEMENT-TIME graph look like this:
Okay - let's look back at the 2nd interval of the v-t graph:
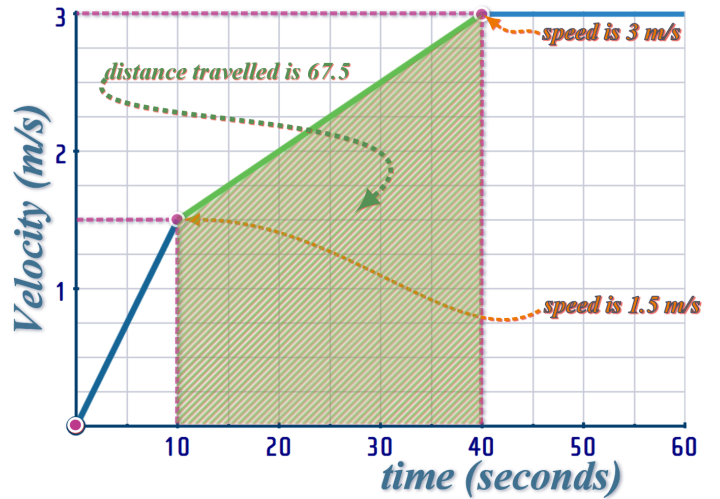
And, translating this information onto the x-t graph:
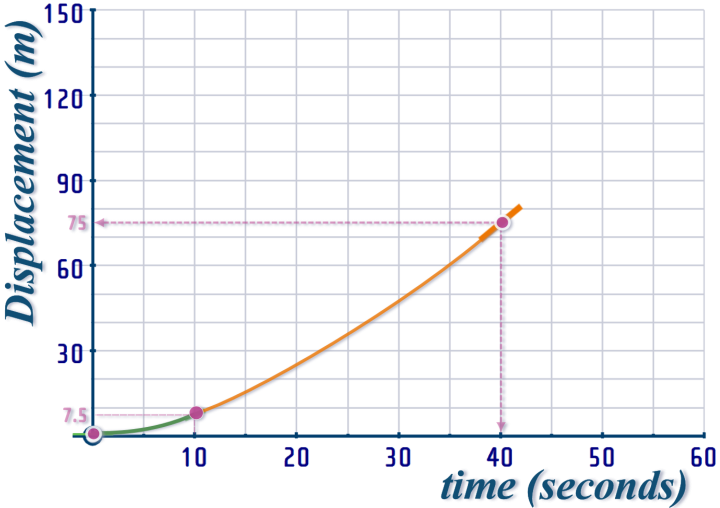
And, I'll leave you to carry on with the final interval...
...it's easier!
Question 10, part (b): As I said before, this is EASIER than Part (a)...
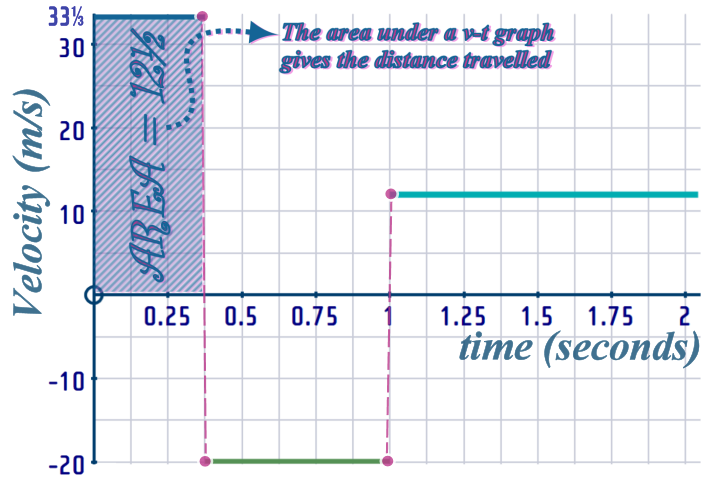
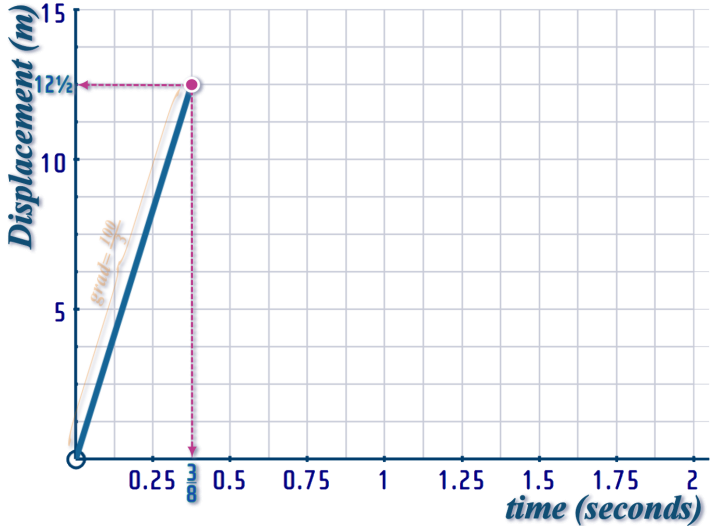
1st Interval: \(t=0\) to \(t=\frac{3}{8}\)
This is uniform velocity (i.e. steady-speed) - the velocity is: \(33\frac{1}{3}\) m/s
The velocity tells us the ‘gradient’ on the displacement-time graph
So, on our DISPLACEMENT-TIME graph; we need to draw a line (from the origin), with \(gradient\,=\,\frac{100}{3}\)
During that same interval, we can work out the DISTANCE TRAVELLED by the particle:
On a velocity-time graph, the ‘area’ gives the distance travelled
So, our displacement-time graph will start off like this:
·
At \(t=\frac{3}{8}\) second, there is a SUDDEN sharp change of direction: Just before \(t=\frac{3}{8}\), it was moving (say, to the right) at \(33\frac{1}{3}\) m/s - but a moment later, it was moving to the LEFT at \(20\) m/s....
As you can see, this causes a quite dramatic DISLOCATION in the velocity-time graph, but the effect is much less striking on the displacement-time graph - all that happens is the gradient changes from \(\frac{100}{3}\) to \(-20\):
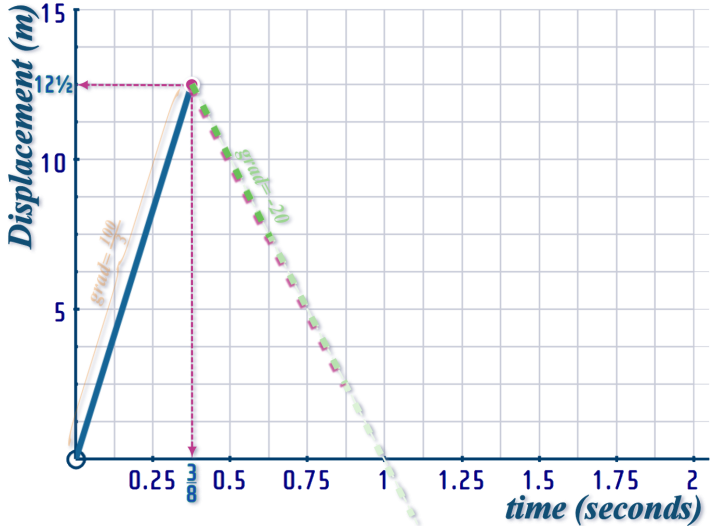
We don't know how far to extend this line...
...to figure that out, we need to know the DISPLACEMENT during the 2nd interval!
(Of course this will be NEGATIVE - we already said, it is moving in the opposite direction, which means the displacement is going to be negative)
We know that, during the 1st interval, it moved a distance of \(12½\) m from ‘home’ - so during this return journey, does it return the full \(12½\) m, or does it return only partway, or maybe it goes so far in the opposite direction, it goes past ‘home’ and keeps on going???
To answer that, we can work out the DISTANCE TRAVELLED during the 2nd interval:
On a velocity-time graph, the ‘area’ gives the distance travelled
After that, there's another dramatic reversal of direction (so it is going back in the original direction again)...
Question 10, part (c): This is tricky - because it is combining what you learnt in Part (a) and what you learnt in Part (b)...
BUT - the first thing you need to do is to sort out the MESS with the UNITS!
What IDIOT used miles per hour (m.p.h.) on the vertical axis, and minutes on the horizontal axis???
Never mind - it's an easy fix:
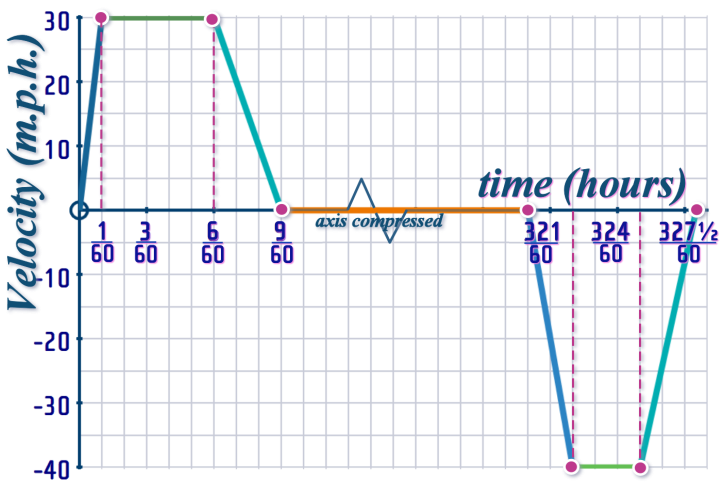
OKAY - now we can carry on...
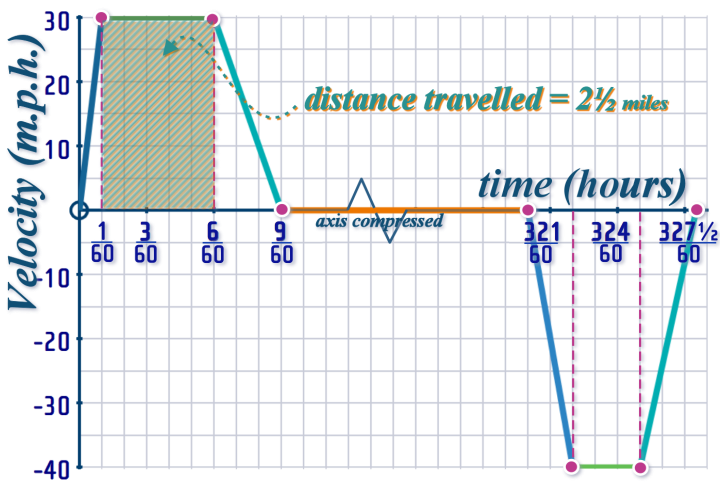
1st INTERVAL: \(t=0\) to \(t=\frac{1}{60}\)
There's an increase in velocity from \(v=0\) to \(v=30\)
NOW: on an x-t graph, the velocity is is the gradient!
The velocity tells us the ‘gradient’ on the displacement-time graph
So, on our DISPLACEMENT-TIME graph; the GRADIENT at \(t=0\) will be ZERO...
...and the gradient at \(t=10\) will be \(30\)
During that same interval, we can work out the DISTANCE TRAVELLED by the particle:
On a velocity-time graph, the ‘area’ gives the distance travelled
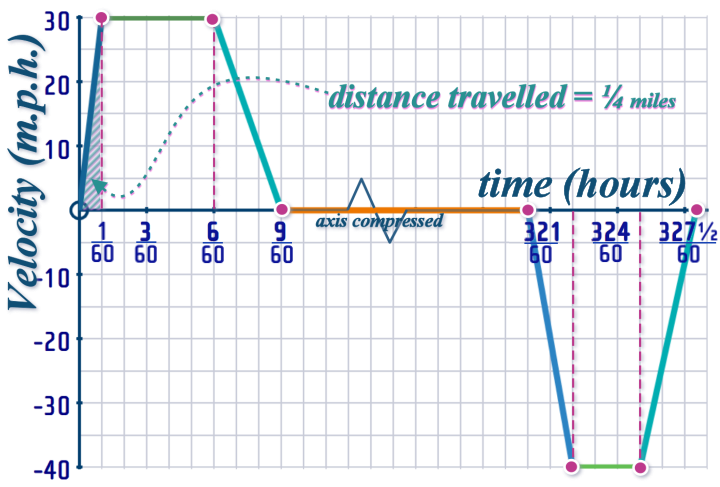
So, the first interval looks like this on a displacement-time graph:
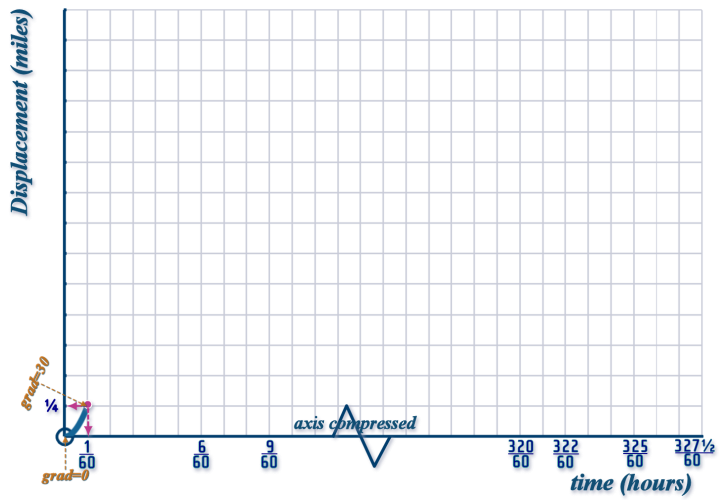
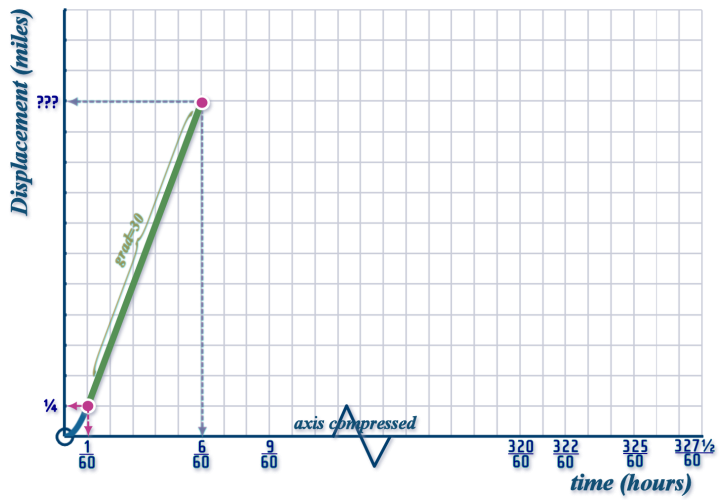
2nd INTERVAL: \(t=\frac{1}{60}\) to \(t=\frac{6}{60}\)
On the velocity-time graph, this is shown as uniform velocity (steady speed) of: 30 m.p.h.
...so on the displacement-time graph, this will be a line of \(gradient=30\)
BUT, how far do we extend the line???
So, the 2nd interval looks like this on our displacement-time graph:
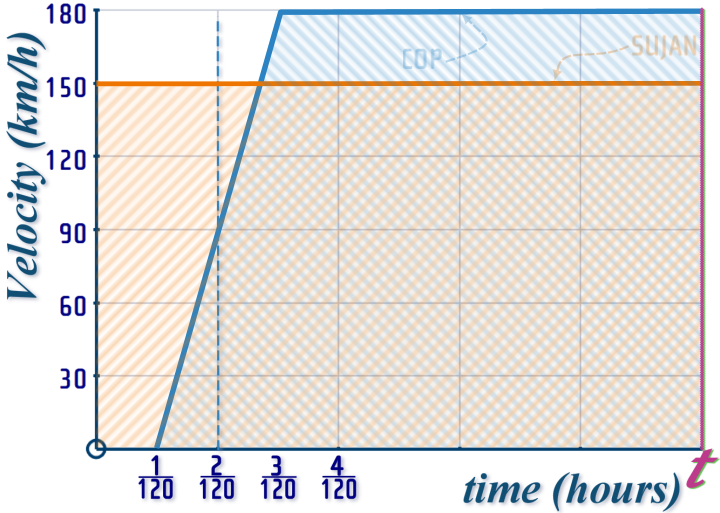
3rd INTERVAL: \(t=\frac{6}{60}\) to \(t=\frac{9}{60}\)
From the velocity-time graph, we can see that the velocity decreases from \(v=30\) to \(v=0\) - so on our displacement-time graph, we'll see the curve start off at \(t=\frac{6}{60}\) with the same gradient as INTERVAL 2, but it will flatten until the curve is horizontal at \(t=\frac{9}{60}\)...
To find the y-value of the displacement-time graph at \(t=\frac{9}{60}\), you need to work out the AREA of the triangle from \(t=\frac{6}{60}\) to \(t=\frac{9}{60}\), then add that to your y-value on your displacement-time graph at the end of INTERVAL 2...
Carrying on like that, you can produce the entire displacement-time graph...
One thing to try to figure out is this: At the end of the journey, is it back where it started???
Question 11: You can't use DIRECT PROPORTION (scale-factor method) for braking distances... So Tomi is WRONG...
...but we can assume the deceleration is the same and so work out the braking distance for \(120\) km/h
So this is CASE 3: Uniform acceleration for the entire interval under investigation
Lets start by looking at the information given about the braking distance when driving at \(48\) km/h:
Defining RIGHT as +VE:   ═══════►
                           +VE
            	╖
So:   u = +48  	║
      v = 0     ║
      a = ???  	║
      t = xxx ──╫──────► Equation (2) omits ‘t’:
      s = +0.032║                            v² =  u² + 2 a s
                ╜                            ⭭     ⭭        ⭭
                                             ⋯	= 48² + 2a(0.032)

                                           => a = ⋯
Now that we've worked out the deceleration, we can use that for another journey - where \(u=120\) and \(v=0\) - in order to find \(s\)
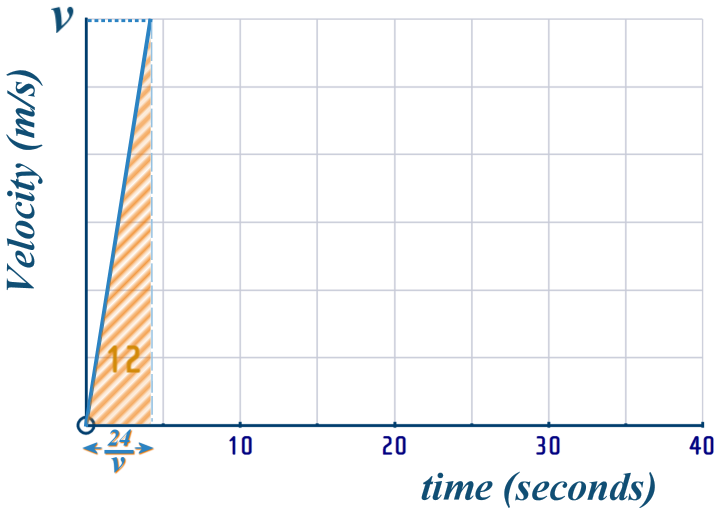
Question 12: This is: CASE 2: Variable Motion; with periods of acceleration, steady speed and deceleration during the interval under investigation
That means - we MUST draw a v-t graph - a sketch graph will do, it doesn't have to be on graph paper...
Let's take this in stages:
INTERVAL 1: First acceleration phase
We know that Pranjal starts from REST and that he covers \(12\) m during the acceleration phase - we'll assume uniform acceleration...
...on a v-t graph, this is represented with a straight line, and the are under the graph is \(12\)
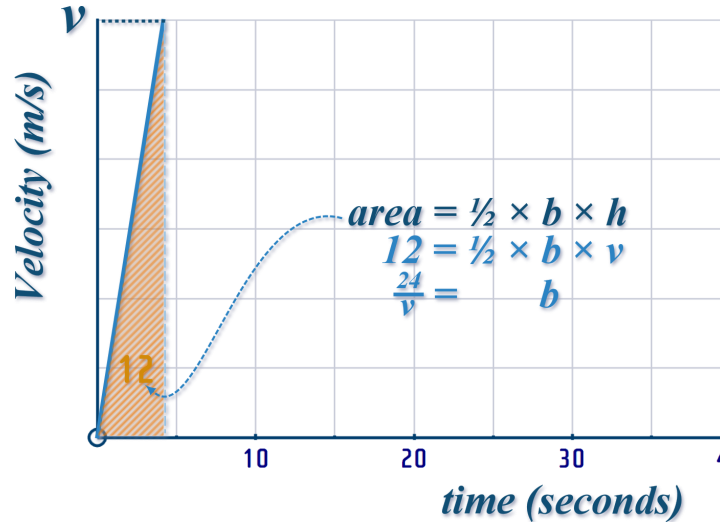
Above, I called the top speed that Pranjal reached \(v\)
And I can use that (together with the \(area\,=\,12\)) to fill in the \(t\)-axis:
After that, we know Pranjal cycles at steady speed for \(30\) seconds and then decelerates at \(1.6\) m/s²:
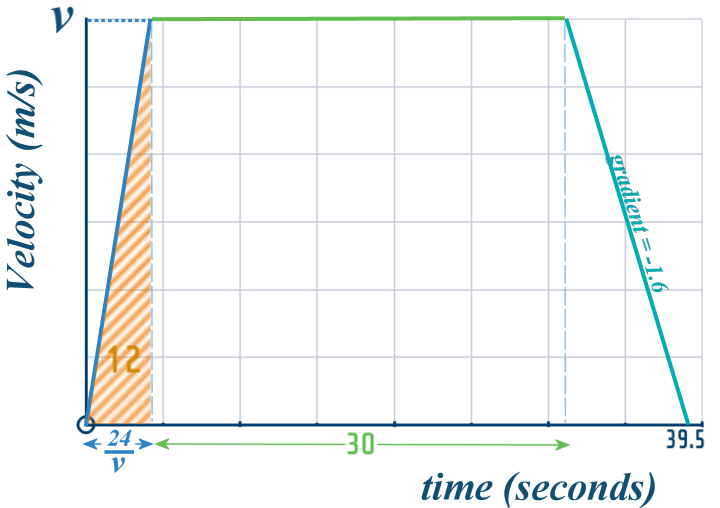
We can use \(gradient\,\,=\,\,\frac{up}{across}\) to again fill in the \(t\)-axis:
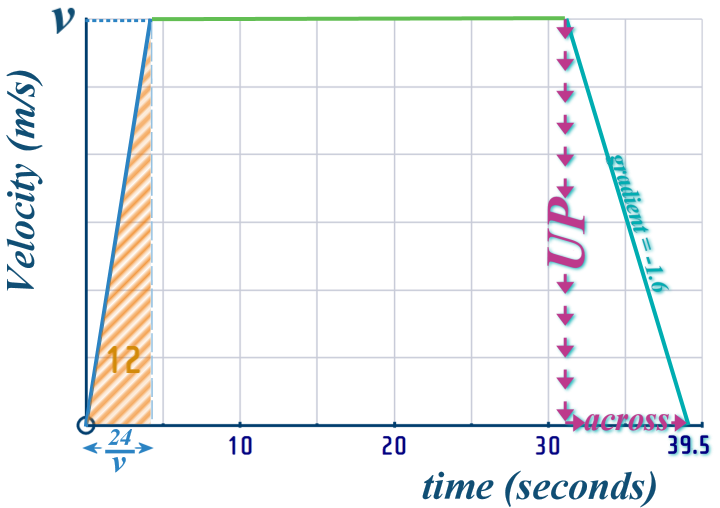
So we now know:
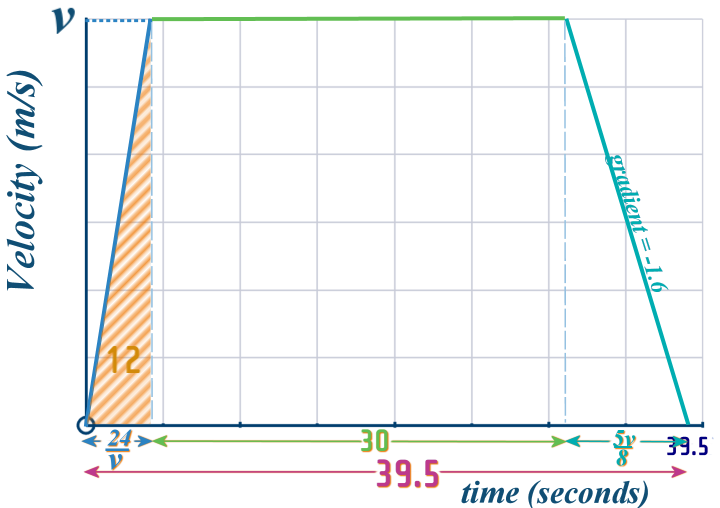
Looking along the \(t\)-axis - we can now form an equation, which we can solve to find everything we'll need...
Question 13: These are perhaps the trickiest types of question...
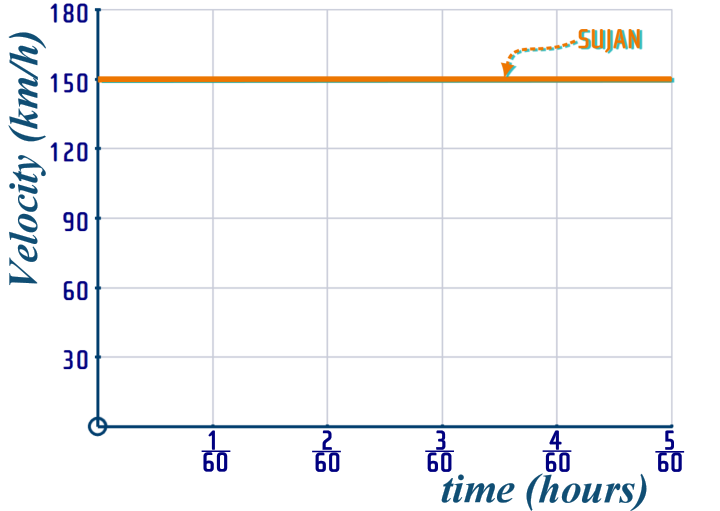
We've already come across situations where we have two different particles moving - but so far, they've been restricted to CASE 3, but this question is CASE 2, so what we've got to do is to draw - ON ONE GRID - the velocity time graphs for both Sujan and the cop...
Lets start with the v-t graph of the speedy Gonzales - Sujan - that's easy, it is just steady speed at \(150\) km/h for the entire time...
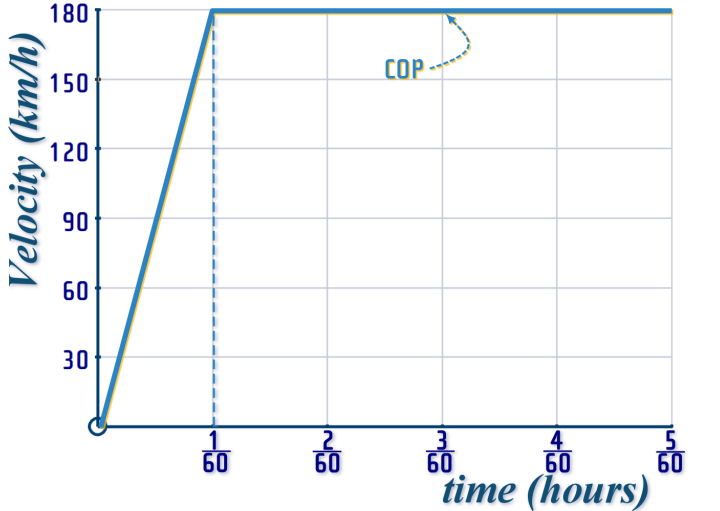
For the cop, we know his acceleration - so we can use the rule: \(\begin{align} Gradient=\frac{up}{across}\,\,\Longrightarrow \,\,10,800&=\frac{up}{\frac{1}{60}}
\\
\Longrightarrow 10,800\times \frac{1}{60} &=up \end{align}\)
So, we know that he reaches a top speed of \(180\) km/h, then goes at steady speed:
So, putting these two journeys onto a SINGLE GRID, we get:
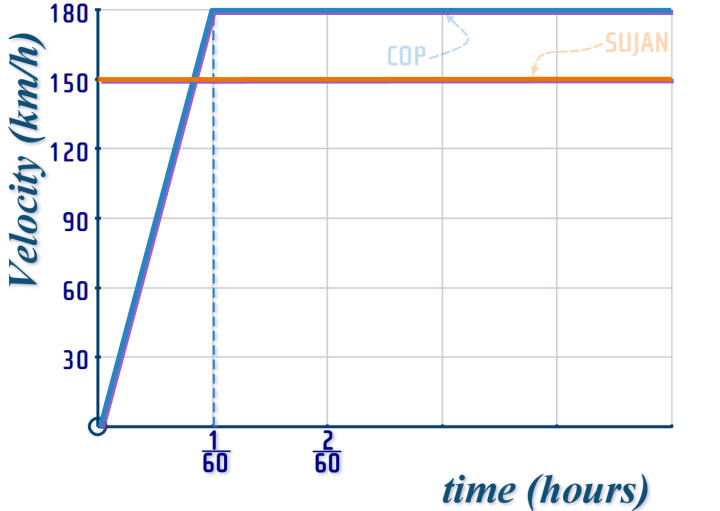
Don't think the point where the orange line intersects the blue line is of particular importance: That's just the point where the COP reaches the same speed as SUJAN - he's still far behind, but from then on, he'll start to reel him in...
To find the time when the COP CATCHES SUJAN: Add a vertical line to your grid (at time \(t\)) - representing the time when the cop catches Sujan:
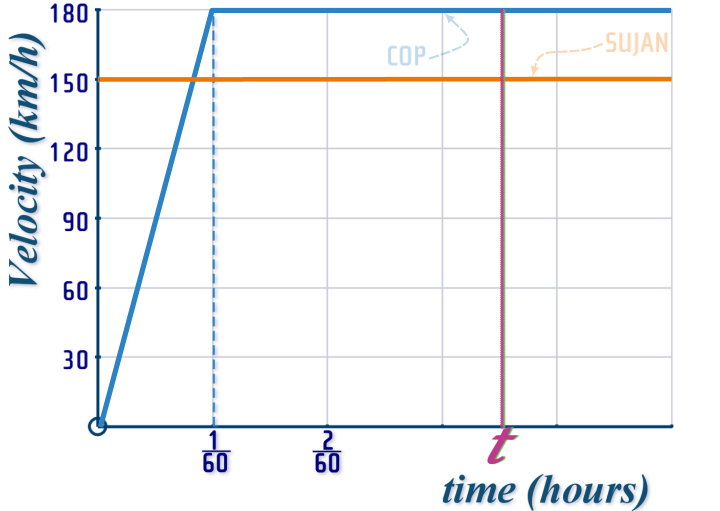
Now work out the distance travelled by Sujan:
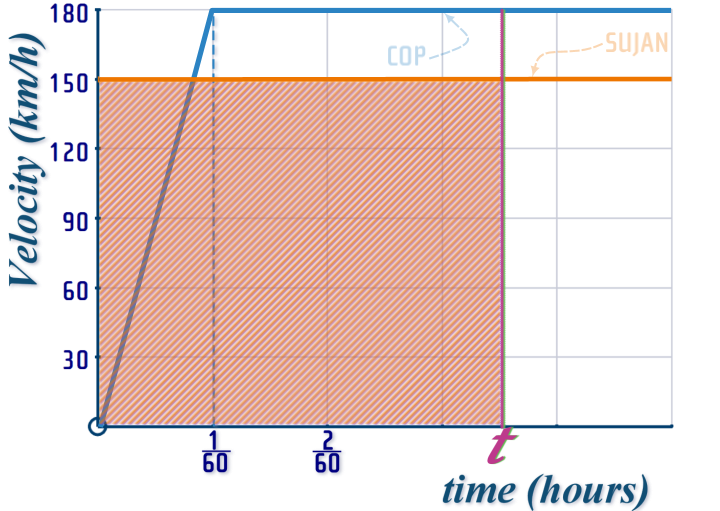
And the distance travelled by the cop
And then just make them equal to each other...
Easy!
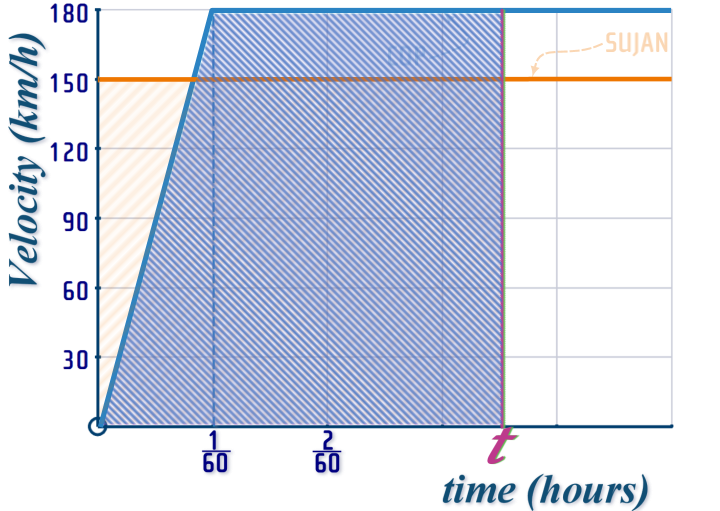
Question 14: It seems so simple, "if the cop takes 30 seconds before he starts chasing Sujan, then surely, he'll just catch him 30 seconds later?"
Of course - it's WRONG!
But, the graph doesn't change much:
Again - simply make the blue area equal the orange area...
Question 15: Lewis again? Yup, I'm a FORMULA 1 fan...
This is CASE 3: Uniform acceleration for the entire interval under investigation
But there are two separate (but linked) journeys going on here:
We can use LEWIS (\(u=???, v=50, a=4, t=5, s=???\) to find out \(s\) (which is the distance from the final corner to the chequered flag) and also \(u) (which is the speed that Lewis comes out of the final corner)...
This information with help us with Verstappen!
Question 16: We are going to use the same method as we did in Questions 13 and 14...
Firstly, let's consider the situation if I'm NOT GIVEN A HEAD START:
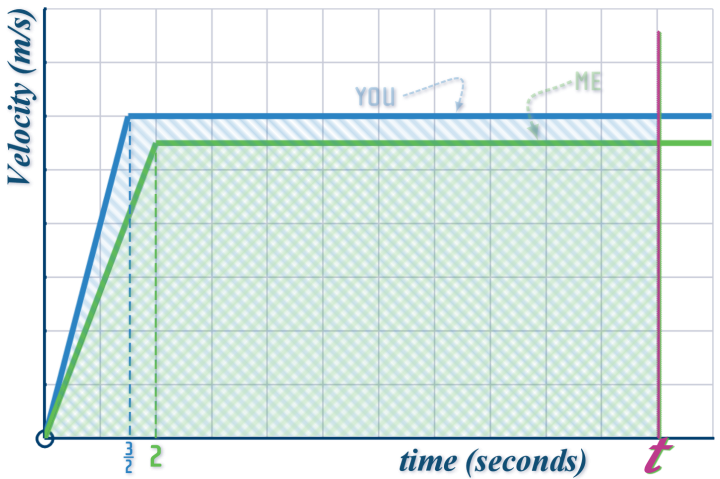
EASY...
....BUT, we need to consider the FACT that I've been given a 20 m head start!
But our axes at \(t\) and \(V\), so the \(20\) m head-start makes no difference to either of those (i.e. it makes no difference to the graph!)
So, how do we account the for head start???
Actually very easy: When you catch up with me, is it true to say: distance run by you = distance run by me?
NO!
Because you had to run 20 m more, innit...
Is it true to say: distance run by you = 20m more than distance run by me?
Yes ,that's better!
Question 17: This is: CASE 2: Variable Motion; with periods of acceleration, steady speed and deceleration during the interval under investigation
That means - we MUST draw a v-t graph - a sketch graph will do, it doesn't have to be on graph paper...
Let's take this ONE INTERVAL AT A TIME:
1st INTERVAL: Acceleration phase
We know that the train starts from REST - that's ALL! So, we'll call the acceleration \(a\) m/s²... and we'll call the speed reached \(v\) m/s
...on the v-t graph, this is represented with a straight line, \(gradient\,=\,a\), \(UP=v\), \(across=???\)
We can use: \(gradient=\frac{UP}{ACROSS}\) to fill in the interval along the \(t\)-axis...
2nd INTERVAL: Steady Speed
On the v-t graph, this is represented with a horizontal line...
...we know the train covers \(1250\) m during this interval, so we can mark the area under out v-t graph as \(1250\) m: \(area\,=\,1250\), \(height=v\) \(width=???\)
We can use: \(AREA=width\times height\) to fill in the interval along the \(t\)-axis...
3rd INTERVAL: Deceleration phase
We know that the deceleration is \(1.5\) times the acceleration. We called the acceleration \(a\) m/s²... So we can call the deceleration \(-\frac{3}{2}a\) m/s
...on the v-t graph, this is represented with a straight line, \(gradient\,=\,-\frac{3}{2}a\), \(UP=-v\), \(across=???\)
We can use: \(gradient=\frac{UP}{ACROSS}\) to fill in the interval along the \(t\)-axis...
Finally, we know the TOTAL TIME for the journey was \(3\) minutes...
...so we can add up the 3 intervals along the \(t\)-axis and equate that to the total time and solve!
EASY!
Question 18: We can separate the VERTICAL MOTION from the HORIZONTAL MOTION - and deal with one at a time...
VERTICAL MOTION:
This is CASE 3: Uniform acceleration for the entire interval under investigation
There's a lot going on - so it is really important to define the INTERVALS carefully and to draw clear diagrams of each interval under investigation...
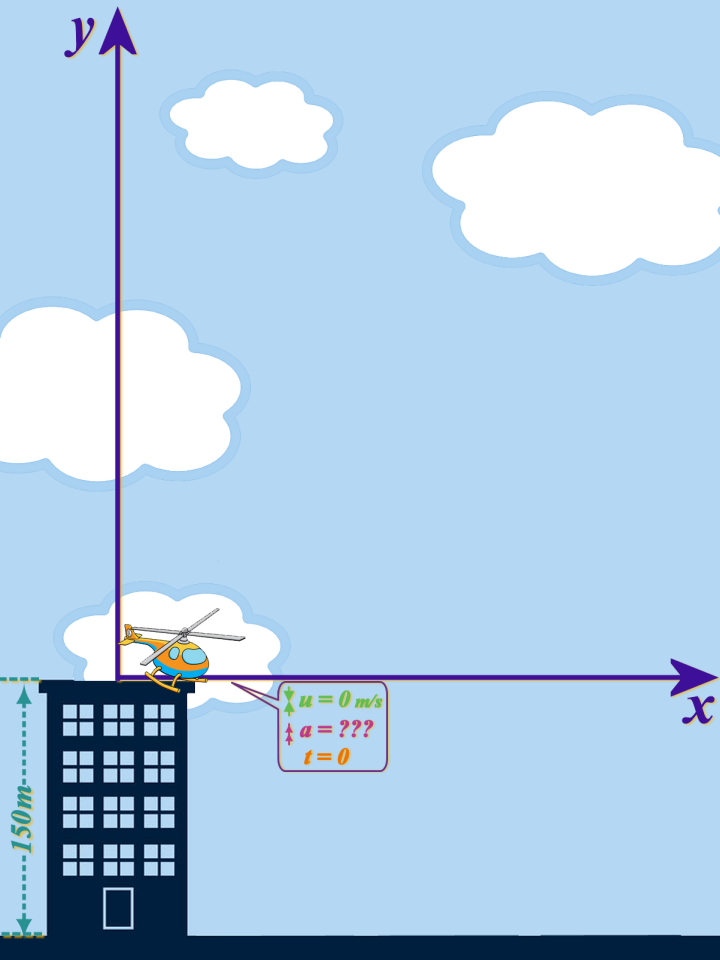
So, to start with, the helicopter is AT REST on the top of the 150 m high building and it is going to take off with a vertical acceleration of \(a\) m/s2 (i.e. we don't know the acceleration)...
It is a good idea to PLACE AXES at the starting point (where \(t=0\):
The next thing we know is that, when it is at a height of 210 m (above the ground), it is moving upwards at 5 m/s
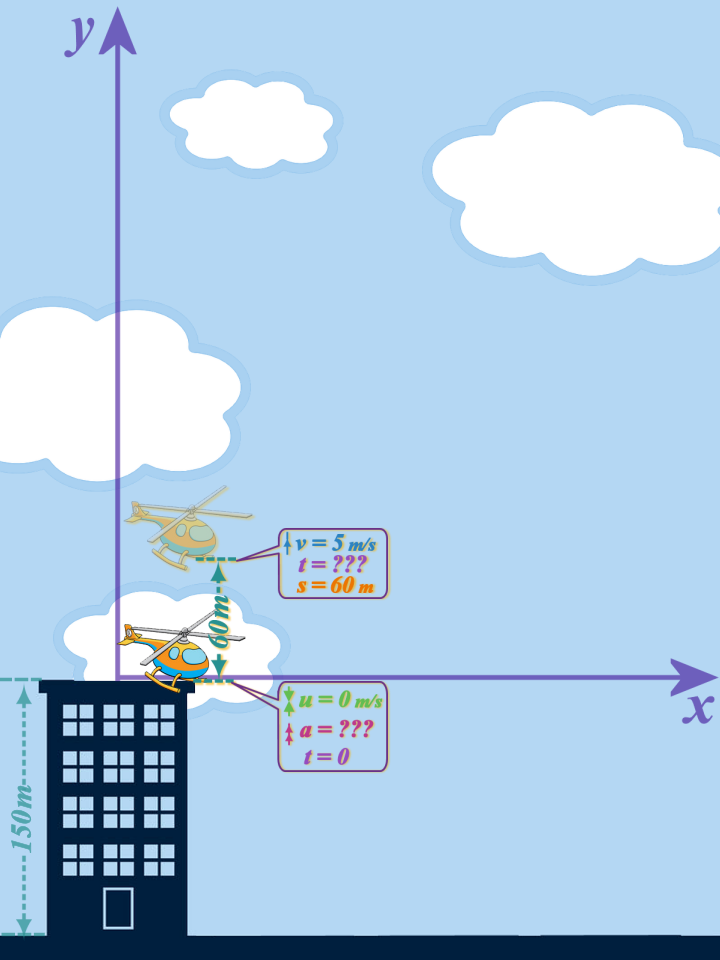
Notice I've NOT labelled \(210\) m on the diagram; because our y-axis starts at the top of the building, so the helicopter is only 60 m above where it started...
INTERVAL #1:
\(\left. \begin{array}{r} u=0\\ v=+5\\ a=?\\ \cancel{t=?}\\ s=+60\\ \end{array} \right\} \,\,v^2=u^2+2as\)
I cancelled \(t\) because we don't need to find it...
Now that we've found the acceleration, we can use that to find how fast the helicopter was rising when the parcel was released - we need to know that, because if the helicopter is rising when it releases the parcel, then it is kinda the same as if you throw the parcel up....
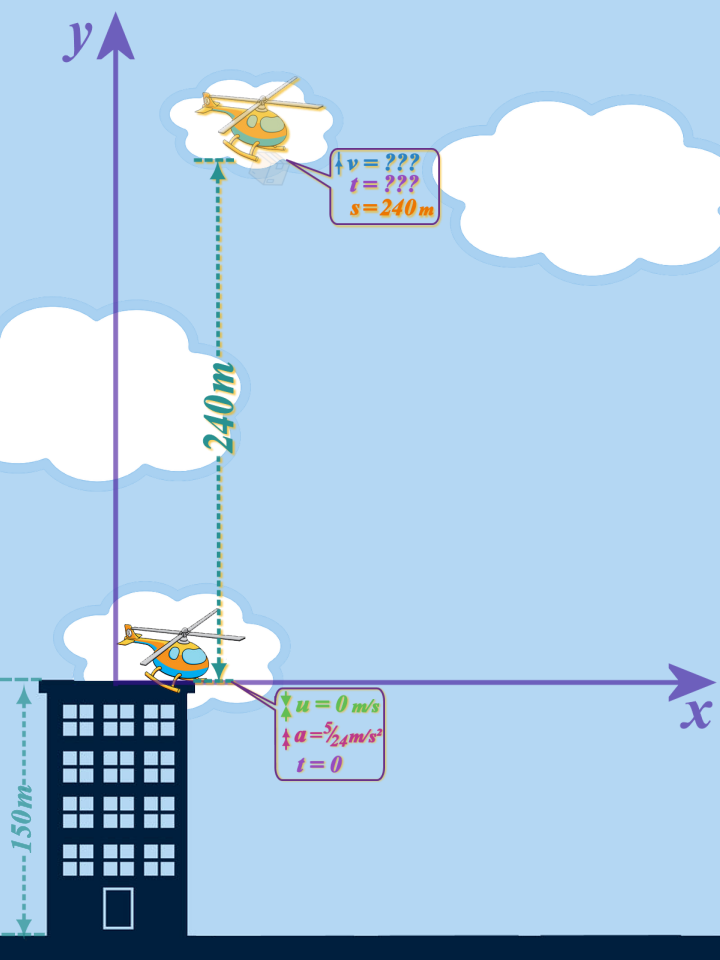
INTERVAL #2 is from when the helicopter is at \(210\) m to \(390\) m (when it releases the Parcel A), and - as I said above - we want to find the speed at the end of INTERVAL #2, but there are two ways we can do that:
LOOKING AT INTERVAL #2 ONLY
\(\left. \begin{array}{r} u=+5\\ v=?\\ a=+\frac{5}{24}\\ \cancel{t=?}\\ s=+180\\ \end{array} \right\} \,\,v^2=u^2+2as\)
COMBINING INTERVAL #1 & INTERVAL #2
\(\left. \begin{array}{r}< u=0\\ v=?\\ a=+\frac{5}{24}\\ \cancel{t=?}\\ s=+240\\ \end{array} \right\} \,\,v^2=u^2+2as\)
For me, it seems easier to use use the second one of those - as I've shown in this diagram...
So then, we can find what speed the helicopter was moving upwards when it released Parcel A - which gives us the initial speed of Parcel A
...(but let's find the time for this journey as well - we might need that later)
Now, we wanna switch our attention to Parcel A: So we'll move our axes to the POINT where the parcel is released: Once it is released, it will free-fall towards the ground; so our diagram will look like this:
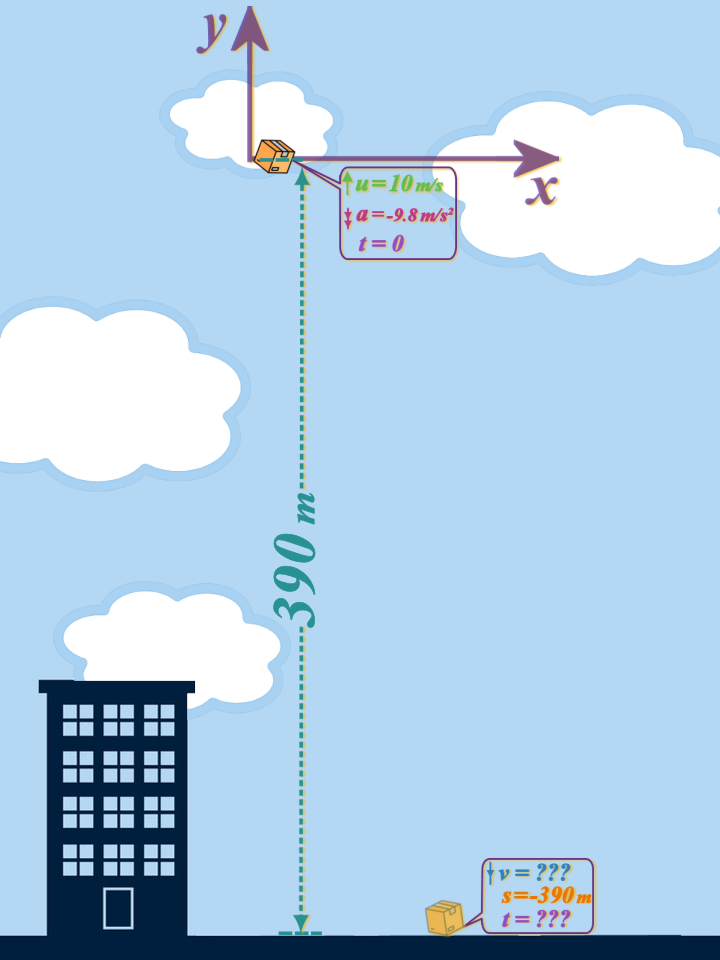
\(\left. \begin{array}{r} u=+10\\ \cancel{v=?}\\ a=-9.8\\ t=?\\ s=-390\\ \end{array} \right\} \,\,s=ut+\frac{1}{2}at^2\)
BUT, at the same time as Parcel A is falling to the ground, the helicopter is continuing to rise (still with \(acceleration = \frac{5}{24}\)), and when it reaches a height of \(690\) m high, it releases Parcel B...
...again, it makes sense for us to combine INTERVALS #1, #2 & #3 (for the helicopter) - and consider to complete journey from a height of \(60\) m to a height of \(690\) m: Again, we need to know how fast the helicopter is rising at the point when it releases Particle B...
...(but let's find the time for this journey as well - we might need that later)
Then we switch attention to Parcel B, placing our axes at the point that it is released: and work out how long it takes to drop to the ground
HORIZONTAL MOTION:
This is really easy, because the horizontal motion for the all the objects (the helicopter and the two parcels) is STEADY SPEED at \(10\) m/s throughout...
So, the helicopter moved eastwards \(240\) m (\(24 secs\,\times 10 m/s\)) before Parcel A was released...
Parcel A moves eastwards \(100\) m as it falls (\(10 secs\,\times 10 m/s\))
Until Parcel B is released, the helicopter moves a further \(240\) m eastwards...
And, as Parcel B falls to the ground, it moves
But you don't need all of this info; you just need to know the time interval between the parcels landing on the ground...